There’s no argument that alcohol has a negative impact on your ability to drive. After reaching a blood alcohol concentration (BAC) of .08% you begin to lose muscle coordination, react more slowly, lack concentration, and have worse judgment. Thus, all 50 states, including Washington D.C. and Puerto Rico, have made it illegal to drive past this point.
These facts and laws still do not prevent many people from getting behind the wheel after having a few drinks. According to the National Highway Traffic Safety Administration, an alcohol-impaired driving fatality coincides with the legal limit and is considered any fatal crash involving a driver with a BAC of .08% or higher. In 2014, there were 9,967 people killed in these types of crashes, which translates to one death every 53 minutes in the United States. Considering that there were a total of 32,675 traffic fatalities in the United States for the entire year, the fact that alcohol played a role in such a high number of deaths is staggering.
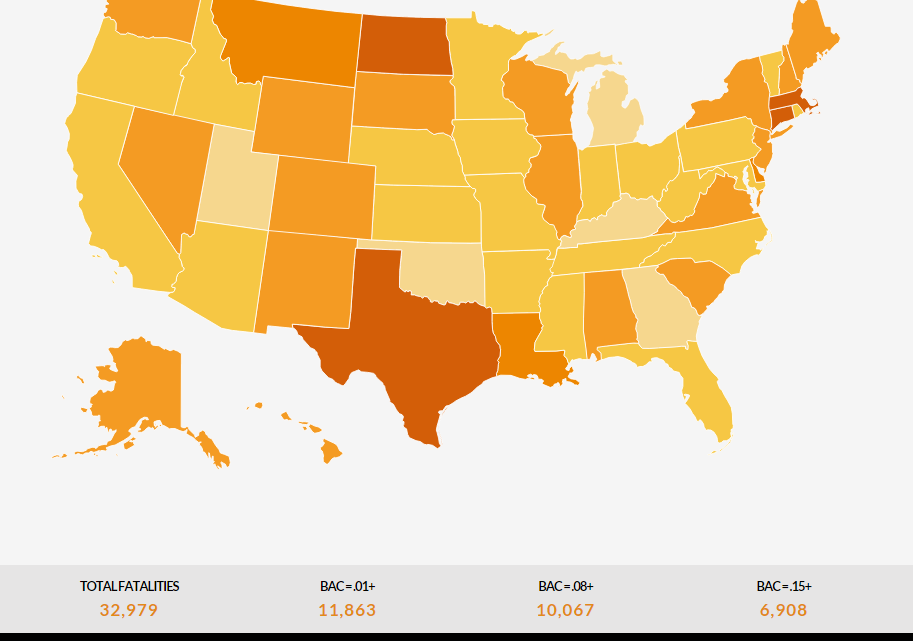
These numbers are tragic when viewing the country as a whole, especially considering that drivers with a BAC of .08% or higher involved in fatal crashes were six times more likely to have a prior conviction for a DUI. However, a state by state breakdown reveals that certain areas have more of a problem with this than others. To highlight these differences, the Omaha personal injury lawyers at Knowles Law Firm took data from the NHTSA to create an interactive map showing the number of alcohol involved traffic fatalities by state.
After parsing through the data, some of the results are unexpected. For example, rural North Dakota tops out the list with almost half (49%) of the state’s overall traffic deaths influenced by the presence of alcohol and comes in third in terms of alcohol consumption per capita. Massachusetts is tied for second at 47% but also had some of the fewest DUI arrests in 2015. Connecticut, which has some of the strictest DUI laws in the country, is number four on the list at 46%.
Other results follow more of a logical pattern. For example Wyoming, near the middle at 36%, has almost twice the amount of drunk driving arrests as the next state, which undoubtedly contributes to its lower number of alcohol related traffic deaths. Likewise, Delaware’s almost nonexistent number of DUI arrests correlates with a 42% rate of vehicle fatalities involving alcohol. Utah also exhibits a pattern with the lowest rate of both alcohol consumption and alcohol related traffic fatalities, likely helped by religious doctrine.
As indicated by the above analysis, it’s not always easy to determine what correlates to higher numbers of drunk driver crashes and fatalities. Strict laws don’t always deter drivers from getting behind the wheel, just as the regular occurrence of alcohol related deaths don’t necessarily lead to the increased presence of law enforcement and more arrests. A number of factors can play a role, including a state’s temperature, laws, penalties, police staffing levels, or even the values of a particular community. What do you think influences the high rate of drunk drivers in some of these areas?


No Comment