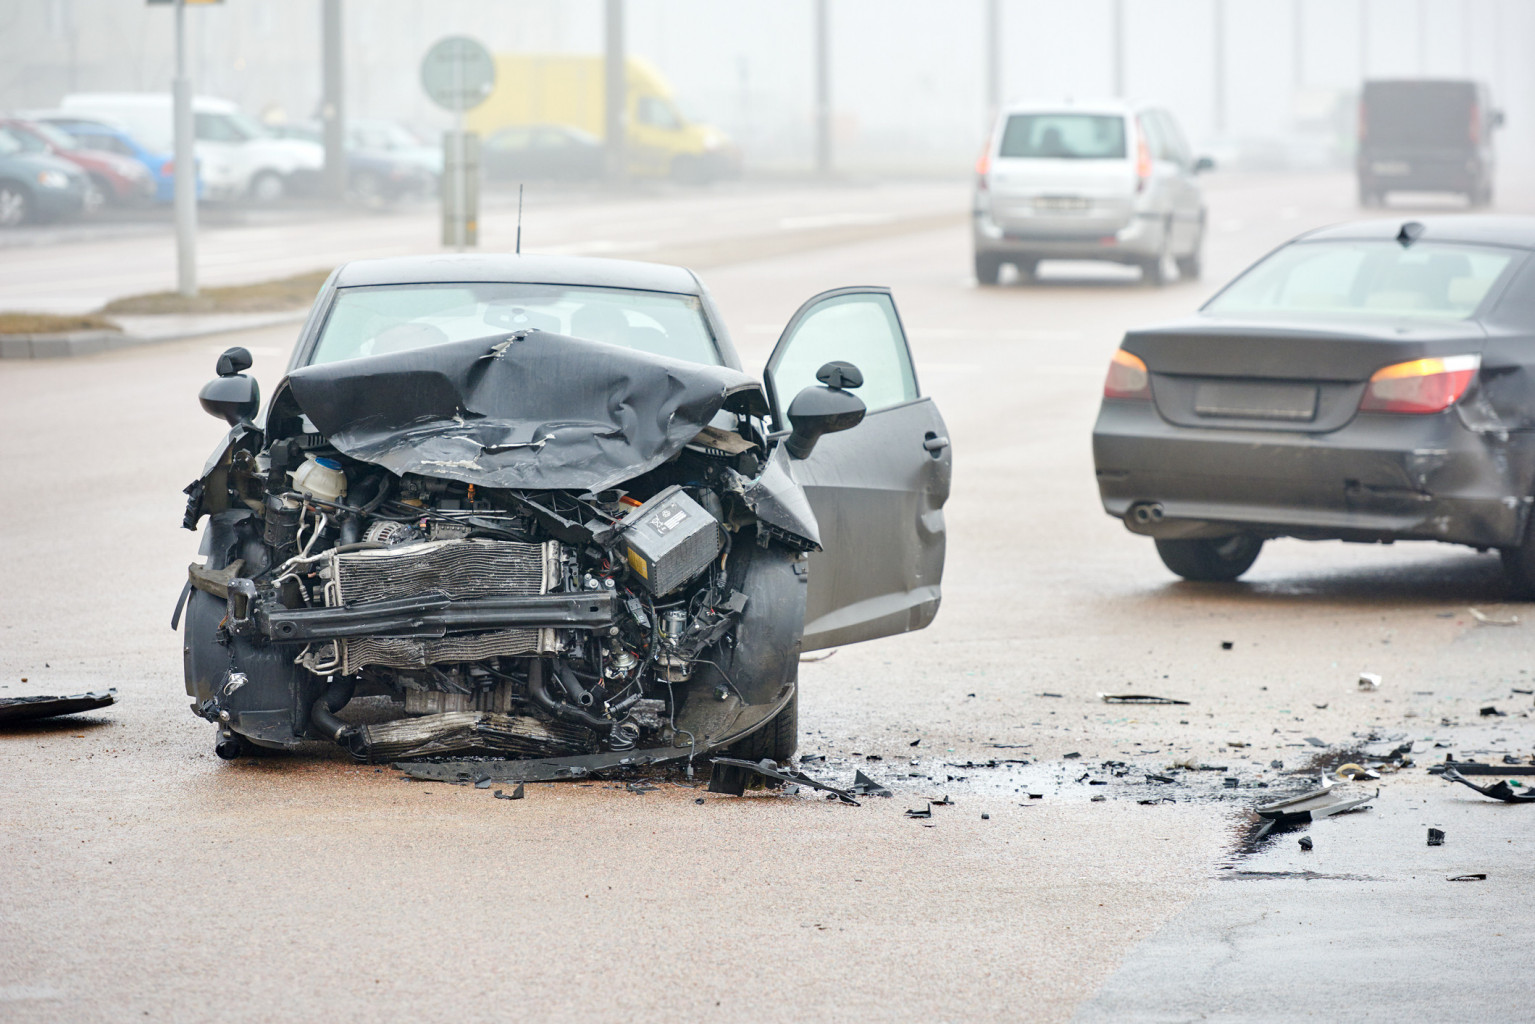
Driving under the influence (DUI) can cause considerable harm, both to the impaired driver and any number of pedestrians, bicyclists, and fellow motorists. According to Mothers Against Drunk Driving (MADD), there were an estimated 38,680 motor vehicle-related fatalities in 2020. This represents a spike in traffic deaths of approximately 7% as compared to 2019. MADD attributes this rise in traffic fatalities to speeding, failure to wear a seatbelt, and impaired driving.
In today’s article, we examine DUI statistics and laws by state. We wanted to explore which states have the strictest DUI regulations and enforcement, the most significant DUI-related crashes and injuries, and other essential figures. For this study, we draw primarily upon data from 2019, as DUI crash data for all states in 2020 has not yet been made public.
Which States Experience the Most DUI Fatalities?
Using data sourced from the National Highway Traffic Safety Administration (NHTSA), we plotted the percentage of each state’s fatal crashes that involved alcohol and the highest blood alcohol concentration (BAC) between all drivers involved in a crash situation. For example, if there were two crash fatalities in a three-vehicle accident where the highest driver BAC was 0.09, both deaths would be tallied under “# of Fatalities, Highest Driver BAC = 0.08+.”
Notable takeaways:
- Rhode Island (44%), North Dakota (41%), and New Hampshire (40%) had the highest percentages of alcohol-related crash fatalities
- In 20 states, 30% or more of crash deaths involved alcohol
- California, Florida, and Texas (in some order) led all states in the number of crash-related fatalities in all three tracked categories: driver BAC of 0.0, driver BAC 0.08 or higher, and driver BAC of 0.15 or higher
- The District of Columbia had the least crash-related deaths in 2019, at 26. Vermont (49) and Rhode Island follow (71), despite Rhode Island having the highest percentage of DUI-related lethal accidents
| State | % of Statewide Fatal Crashes Involved Alcohol | # of Fatalities, Highest Driver BAC = 0.0 | # of Fatalities, Highest Driver BAC = 0.8+ | # of Fatalities, Highest Driver BAC = 0.15+ |
| Alabama | 30% | 603 | 277 | 187 |
| Alaska | 28% | 41 | 22 | 12 |
| Arizona | 27% | 670 | 260 | 176 |
| Arkansas | 25% | 347 | 128 | 89 |
| California | 28% | 2,473 | 949 | 630 |
| Colorado | 27% | 395 | 164 | 121 |
| Connecticut | 38% | 139 | 94 | 61 |
| Delaware | 24% | 97 | 31 | 24 |
| District of Columbia | 26% | 15 | 6 | 5 |
| Florida | 25% | 2,258 | 790 | 529 |
| Georgia | 24% | 1,066 | 353 | 224 |
| Hawaii | 38% | 62 | 36 | 20 |
| Idaho | 34% | 143 | 68 | 51 |
| Illinois | 31% | 640 | 314 | 213 |
| Indiana | 26% | 576 | 210 | 145 |
| Iowa | 30% | 212 | 100 | 67 |
| Kansas | 22% | 311 | 91 | 59 |
| Kentucky | 20% | 552 | 150 | 106 |
| Louisiana | 30% | 473 | 220 | 144 |
| Maine | 32% | 99 | 50 | 36 |
| Maryland | 32% | 332 | 167 | 112 |
| Massachusetts | 33% | 202 | 110 | 78 |
| Michigan | 26% | 681 | 261 | 169 |
| Minnesota | 24% | 262 | 86 | 58 |
| Mississippi | 26% | 443 | 170 | 118 |
| Missouri | 27% | 598 | 235 | 154 |
| Montana | 38% | 113 | 66 | 50 |
| Nebraska | 24% | 177 | 58 | 38 |
| Nevada | 30% | 191 | 92 | 66 |
| New Hampshire | 40% | 55 | 40 | 29 |
| New Jersey | 23% | 391 | 129 | 81 |
| New Mexico | 31% | 267 | 129 | 89 |
| New York | 28% | 614 | 262 | 170 |
| North Carolina | 24% | 1,002 | 323 | 215 |
| North Dakota | 41% | 52 | 41 | 32 |
| Ohio | 30% | 727 | 351 | 232 |
| Oklahoma | 24% | 457 | 154 | 120 |
| Oregon | 22% | 283 | 167 | 118 |
| Pennsylvania | 28% | 712 | 298 | 204 |
| Rhode Island | 44% | 27 | 25 | 19 |
| South Carolina | 28% | 671 | 285 | 197 |
| South Dakota | 27% | 70 | 28 | 18 |
| Tennessee | 26% | 800 | 290 | 201 |
| Texas | 37% | 2,068 | 1,332 | 890 |
| Utah | 16% | 199 | 39 | 26 |
| Vermont | 19% | 33 | 9 | 7 |
| Virginia | 28% | 548 | 236 | 171 |
| Washington | 37% | 310 | 172 | 119 |
| West Virginia | 22% | 196 | 56 | 36 |
| Wisconsin | 32% | 361 | 183 | 126 |
| Wyoming | 25% | 100 | 36 | 30 |
| U.S. Totals | N/A | 24,114 | 10,143 | 6,872 |
What Are Each State’s DUI Laws?
Every state in the U.S. has its own parameters for determining whether a driver was under the influence and what mandatory punishments are to be assigned for a DUI.
The chart below details the following information for each state:
- “Zero Tolerance” BAC Level: In all U.S. states and the District of Columbia, drivers under the age of 21 are held to much stricter alcohol consumption limits. It is illegal for people under 21 to purchase and consume alcohol, and most states have corresponding “zero-tolerance” DUI laws. These set the BAC levels for a DUI between 0 – 0.02 for drivers under the legal drinking age.
- Alcohol Per Se Level: “Per se” laws establish that, at or over the BAC level determined by the state, a driver is considered legally intoxicated. For most states, the “per se” value is 0.08.
- Enhanced Penalties for High BAC: In some states, drivers who reach or exceed a specific BAC may face stiffer punishments. Typically, this takes the form of a longer sentence or a more serious criminal charge. This may be referred to as an “aggravated DUI” in some states. The corresponding column displays whether a state has enhanced penalties for a high BAC and, if applicable, what that corresponding value is.
| State | “Zero Tolerance” BAC Level | Alcohol Per Se Laws | Enhanced Penalties for High BAC? |
| Alabama | 0.02 | 0.08 | 0.15 |
| Alaska | 0 | 0.08 | No |
| Arizona | 0 | 0.08 | 0.15 |
| Arkansas | 0.02 | 0.08 | No |
| California | 0.02 | 0.08 | 0.15 |
| Colorado | 0.02 | 0.08 | 0.15 |
| Connecticut | 0.02 | 0.08 | No |
| Delaware | 0.02 | 0.08 | 0.15 |
| District of Columbia | 0 | 0.08 | 0.2 |
| Florida | 0.02 | 0.08 | 0.15 |
| Georgia | 0.02 | 0.08 | 0.15 |
| Hawaii | 0.02 | 0.08 | No |
| Idaho | 0.02 | 0.08 | 0.2 |
| Illinois | 0 | 0.08 | 0.16 |
| Indiana | 0.02 | 0.08 | 0.15 |
| Iowa | 0.02 | 0.08 | 0.15 |
| Kansas | 0.02 | 0.08 | 0.15 |
| Kentucky | 0.02 | 0.08 | 0.15 |
| Louisiana | 0.02 | 0.08 | 0.15 |
| Maine | 0 | 0.08 | 0.15 |
| Maryland | 0.02 | 0.08 | 0.15 |
| Massachusetts | 0.02 | 0.08 | 0.2 |
| Michigan | 0.02 | 0.08 | 0.17 |
| Minnesota | 0 | 0.08 | 0.16 |
| Mississippi | 0.02 | 0.08 | No |
| Missouri | 0.02 | 0.08 | 0.15 |
| Montana | 0.02 | 0.08 | 0.16 |
| Nebraska | 0.02 | 0.08 | 0.15 |
| Nevada | 0.02 | 0.08 | 0.18 |
| New Hampshire | 0.02 | 0.08 | 0.16 |
| New Jersey | 0.01 | 0.08 | 0.1 |
| New Mexico | 0.02 | 0.08 | 0.16 |
| New York | 0.02 | 0.08 | 0.18 |
| North Carolina | 0 | 0.08 | 0.15 |
| North Dakota | 0.02 | 0.08 | 0.18 |
| Ohio | 0.02 | 0.08 | 0.17 |
| Oklahoma | 0.02 | 0.08 | 0.15 |
| Oregon | 0 | 0.08 | 0.15 |
| Pennsylvania | 0.02 | 0.08 | 0.16 |
| Rhode Island | 0.02 | 0.08 | 0.15 |
| South Carolina | 0.02 | 0.08 | 0.16 |
| South Dakota | 0.02 | 0.08 | 0.17 |
| Tennessee | 0.02 | 0.08 | 0.2 |
| Texas | 0.02 | 0.08 | 0.15 |
| Utah | 0.02 | 0.05 | 0.16 |
| Vermont | 0.02 | 0.08 | 0.16 |
| Virginia | 0.02 | 0.08 | 0.15 |
| Washington | 0.02 | 0.08 | 0.15 |
| West Virginia | 0.02 | 0.08 | 0.15 |
| Wisconsin | 0.02 | 0.08 | 0.17 |
| Wyoming | 0.02 | 0.08 | 0.15 |
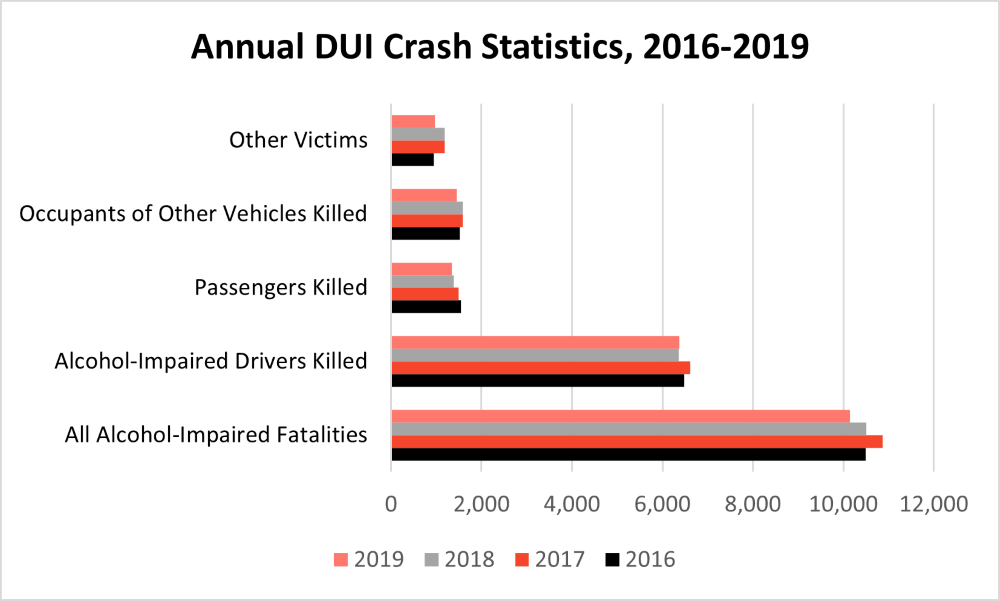
Annual DUI Crash Statistics, 2016-2019
There were at least 10,142 annual alcohol-related fatalities from 2016 to 2019. Alcohol-impaired drivers suffered the most recorded fatalities throughout the tracked period. We graphed critical DUI crash statistics below. In our chart, “other victims” include pedestrians, bicyclists, and others that suffered fatal injuries.
What to Do if You’re Hit by an Impaired Driver?
All car accidents can be incredibly stressful, regardless of whether you suspect that another driver is under the influence of drugs or alcohol. If you are in a crash where you reasonably believe one or more drivers may be impaired:
- Check yourself and your passengers for injuries
- Maneuver your vehicle out of traffic and to a safe place (if possible) or seek a secure location
- Call the police to report a suspected DUI crash and obtain a copy of their report
- Collect information, such as photographs of the scene and witness phone numbers
- Visit a doctor to get treatment for any injuries, even if you do not believe you suffered serious harm
- Call a personal injury lawyer experienced in your local region’s DUI laws
Additional Sources Cited
https://www.cdc.gov/nchs/pressroom/sosmap/accident_mortality/accident.htm
https://www.responsibility.org/alcohol-statistics/state-map/issue/enhanced-penalties-for-high-bac/

No Comment