People love crime. Not in the sense of becoming victims, of course; but, many are addicted to crime TV dramas, outraged when the guilty get light sentences or when the guilty are later proved innocent. Parallel to our crime infatuation is the desire – and need- for safety. Less sexy of a topic, it’s the soft-spoken sister.
But “the safest” and “most dangerous” mean nothing without the other, which explains why a ranking of California’s most dangerous city recently made waves in local newsrooms and was met with diverse reactions. Facebook posts from residents of the top ten cities ranged from “I don’t want to be a statistic” to “We Win! We’re Number One! (This comment is sarcasm)…” and “I’ve been here since 89 and that has never been my perspective”.
So what is California’s most dangerous city?
Oakland? Inglewood? Those are the go-to answers. Even a current presidential candidate called out the first for being one of the most dangerous cities in the world, though fact-checkers quickly united to disprove his statement.
Both of those cities, however, did make the top ten while San Bernardino, a recent terror-stricken city in Southern California, took home the not so coveted position of No.1
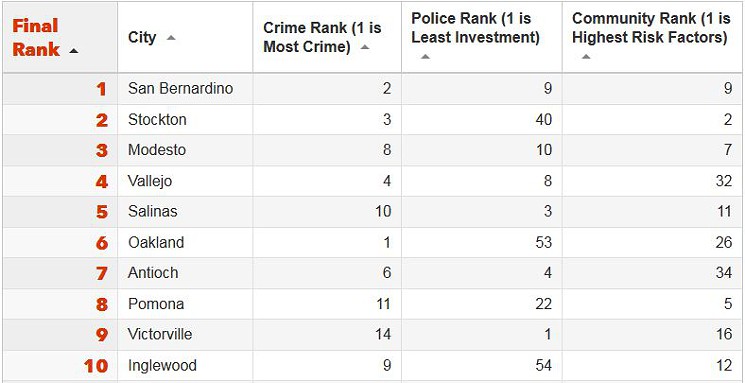
This is all according to Southern California defense attorney Graham Donath (who commissioned the study from a local research and data visualization firm). And there’s a reason his study, over the countless others was considered credible- it looked at a variety of community factors that contribute to a city’s overall crime factor.
“Properly understanding crime statistics and trends goes well beyond just looking at the number of crimes that happened in one place during a calendar year, so we decided to take a close look at what makes any particular city “dangerous” beyond just that individual number,” Donath said. “The results are fascinating, although not surprising unfortunately for many people who live in some of the hardest hit areas.”
And he’s correct. The FBI releases an annual Uniform Crime Report (UCR) with crime rate data. This data set was used for part of Donath’s study. It also comes with perhaps one of the most overlooked warning of all time: crime data alone is not enough to draw conclusions of the most dangerous and safest areas. They go on to list 13 other community factors known to affect the volume and type of crime committed in a particular place, citing population as the only correlate of crime in their annual reports. Donath’s study only analyzed cities with at least a population of 100,000.
So what does make one city more dangerous than the next, besides the obvious crime rate? And what makes San Bernardino the most dangerous city in California?

COMMUNITY FACTOR: POVERTY
Every city in the top ten of Donath’s study has a poverty rate higher than 14.5 percent with San Bernardino topping out the list at 30.6 percent. For comparison, the bottom ten- or the least dangerous of the 68 cities analyzed- all have poverty rates below 12.9 percent.
San Bernardino started as a blue-collar, middle class city– the birthplace of McDonald’s and home to the first U.S. Rolling Stones concert. It’s also among the top 100 biggest U.S. cities and the second-poorest in the nation. In 2012, it was the third California city to file Chapter 9 bankruptcy. Vallejo was the first city to file back in 2008, cutting the police force by a third and eventually becoming a hub for prostitution. Stockton was the second, and subsequently suffered more homicides than ever before. They rank fourth and second on Donath’s study.
San Bernardino is following a similar path, laying off dozens of officers while emergency response times rose and nonemergency calls went unanswered. It’s a stark contrast from just one year prior to the filing where the city’s aggressive gang intervention problem helped cut the homicide rate in half from 2005. The program became a model for other cities under the National League of Cities in 2011.
COMMUNITY FACTOR: EDUCATION & UNEMPLOYENT
Unemployment is, of course, a huge factor in a city’s poverty level; with higher rates of unemployment come higher rates of poverty. Donath cites a separate study where unemployment rates were analyzed independently of poverty rates. There, researchers found a one percent increase in unemployment resulted in a violent and property crime increase of 32 and 71 per 100,000 residents. San Bernardino ties for 26th for highest unemployment rate at 6.1 percent. The highest is Fresno with just over an 11 percent unemployment rate and is No. 20 on the most dangerous list.
Donath’s study also found a moderate to significant correlation between certain types of crimes – car theft, murder, other violent crimes, aggravated assault and robbery- and the percentage of high school graduates. While the top four safest cities have at least a 91 percent rate of high school graduates, the ten most dangerous drop to 83 percent or lower. San Bernardino has a 64 percent graduation rate, while the fifth most dangerous city, Salinas, has the lowest rate at 57 percent. In 2014, the same year of the FBI’s crime data, California ranked last in educational spending per pupil, which may help explain some of the cities low graduation rates.
POLICE PRESENCE & INVESTMENT
Many of the state’s police budgets decreased after the 2008 recession, some more significantly than others. While 2014 saw a .9 percent increase in total law enforcement personnel, it’s still 3 percent lower than 2009. And the cuts have mixed results, seemingly somewhat dependent on the size of the city. Anaheim, No. 28 on the list, saw increases in property and violent crimes after cutting the police force close to eight percent; In Santa Ana, No. 21, violent crime plunged by 24 percent after reducing the police force by four percent.
San Bernardino has a $223 police budget per capita with 104 officers per 100,000 people. However, the dangerous streets are forcing the city’s first responders to wait for police before arriving on scene – a problem already worsened by the aforementioned increased emergency waiting times. This March, a tragic shooting of a 12-year-old boy who was shot at a Circle K. Firefighters were across the street from the boy but waited eight minutes for police to arrive on the scene first, according to CBS.
CLIMATE
Yes, the FBI lists “climate” as one of the factors contributing to an area’s crime rate and The International Journal of Humanities and Social Sciences says it’s evident warmer weather and an increased crime rate are correlated. The problem: people and studies have different definitions of a “high temperature”. Donath’s team counted all the days in a city reaching 80 degrees or more. San Bernardino had 172 days over 80, less that ten shy of the two cities with the most days over 80, Santa Ana and Murrieta with 184, who rank No. 21 and 64. The least amount of hot days? San Francisco with zero and No.14 overall on Donath’s list.
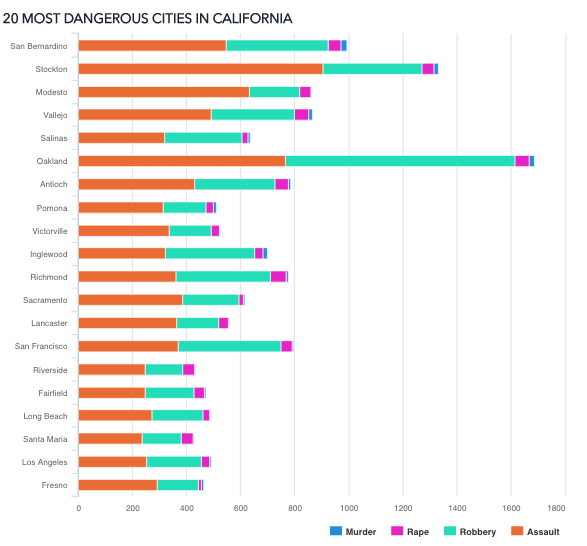
The FBI list even more community factors as does Donath’s. But despite all this, it’s fair to still mention the actual crime rate. Oakland is number one for violent crime, with 1,685 crimes reported per 100,000 people. As for San Bernardino? The city is second for most violent crimes with 795 per 100,000. Want to explore the whole study, look at the methodology or see where your favorite California city ranks? These are the most dangerous California cities.


No Comment